UI & Data Visualization
Diverging scale
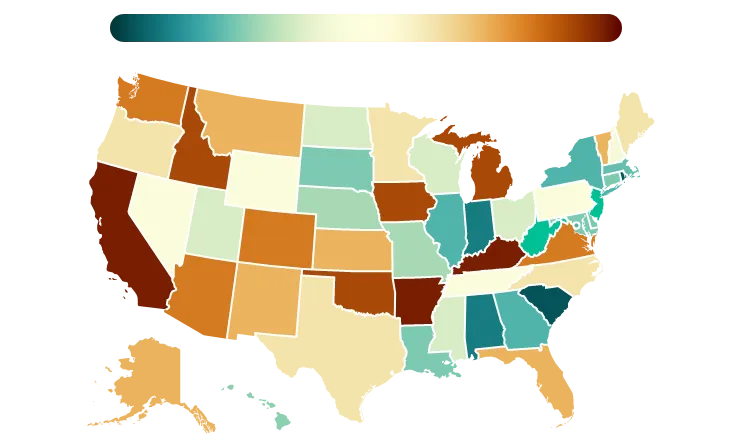
A data visualization scale similar to sequential, except with a neutral midpoint to demonstrate polarity.
Diverging color scales are quantitative.
How it affects UI design
When creating color scales, interpolating in various color spaces will result in different colors or appearance. Use a color appearance model if trying to make your color scale perceptually balanced.
Do not rely on color choice alone to make data visualizations accessible. Additional considerations beyond color and contrast may be necessary.
Diverging scales may be more prone to color conflicts for people who have a color vision deficiency.
Sources:
- Lisa Charlotte Muth. Which color scale to use when visualizing data. Datawrapper. https://blog.datawrapper.de/which-color-scale-to-use-in-data-vis/
- Color for Data Visualization. Adobe Spectrum. https://spectrum.adobe.com/page/color-for-data-visualization/